
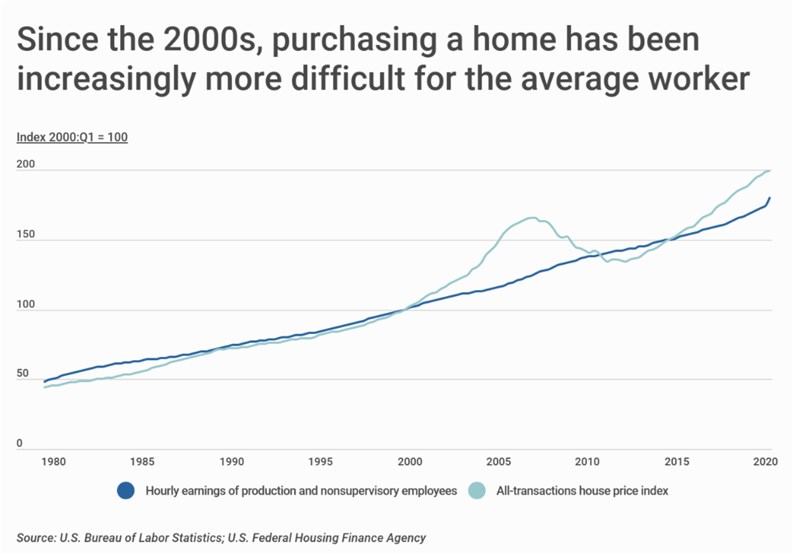
While the numbers being put up by the residential real estate market in NYC are - and have long been - the envy of other regions across the country (with the possible exception being the Bay Area, where Silicon Valley tech money has morphed that market beyond recognition), there’s an ominous downside to the perpetual bullishness of the Big Apple. Data from the federal government indicates that although earnings for production and nonsupervisory workers increased by approximately 80 percent between January 2000 and April 2020, housing costs have nearly doubled during the same period.
That means that despite decades of record-setting home sales, owning a home has become increasingly difficult for the average worker - if not impossible - in most parts of the New York City metro area. According to a recent report by Construction Coverage, an insurer and consultant for both residential and commercial developers nationwide, “Mortgage interest rates are historically low, yet hourly earnings have failed to keep pace with rising housing costs. The rise in home prices over the past several years has occurred during a period of increased housing demand—driven by a growing economy and more millennial homebuyers—as well as a shortage of new, single-family homes available for purchase.”
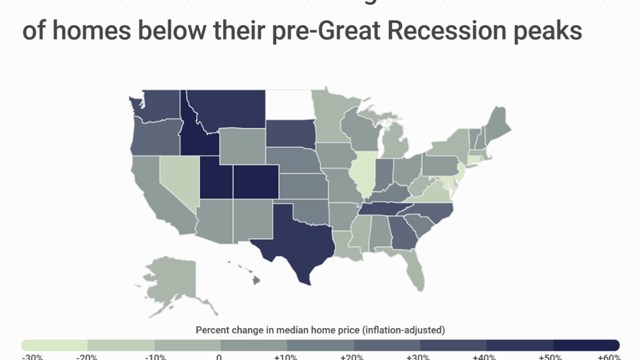
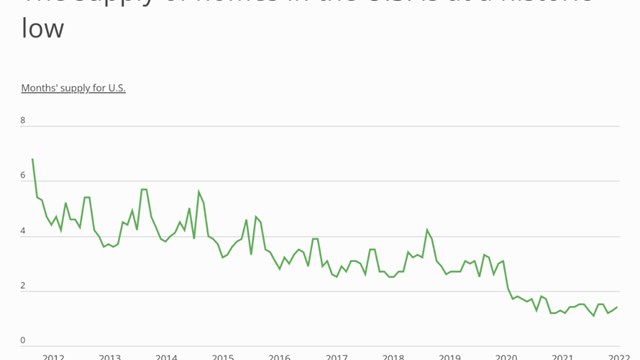
Further, data from the U.S. Census Bureau indicates that new home construction has still not rebounded to pre-Great Recession levels. Recent housing supply data indicates ongoing shortages, with a 7.9 percent decrease in new single-family homes for sale between January and June 2020. Put in Economics 101 terms, the increased demand for housing at a time of diminishing supply has set the stage for a nationwide housing affordability crisis that’s being felt acutely in sky-high markets like the New York metro.
If these rising prices were happening at a time when workers were being compensated at a commensurably increasing rate, this wouldn't be much of a story; young families would have the financial wherewithal - or at least the reasonable expectation of future wherewithal - to take the plunge and make what is likely to be the biggest purchase of their lives. But that’s not what’s happening. According to Construction Coverage’s report, at the same time that home prices have gone up, wages for the average worker have failed to keep pace. And the growth-versus-stagnation picture isn’t evenly distributed across wage-earners; “Research from the Economic Policy Institute shows that while wages for high-income workers grew steadily since the 1980s, middle- and lower-income workers have actually seen their wages stagnate or even decline after adjusting for inflation.”
At the state level, the largest gaps between home price and income growth are found in Western states such as Nevada, Idaho, Utah, Oregon, Washington, Colorado, and Arizona. Home prices in these states outpaced wage growth by more than x3 between 2014 and 2019. In Midwest and East Coast states, home prices grew more slowly relative to income, but still outstripped workers’ earning power. In only three states - North Dakota, Connecticut, and West Virginia - did income growth actually outpace home price growth over the past five years.
To identify metropolitan areas with the greatest rise in home prices relative to income, researchers analyzed data from online real estate listing service Zillow and the U.S. Bureau of Labor Statistics. For each metro, the percentage change in home price between 2014 and 2019 was divided by the percentage change in median wage during the same time period.
Consistent with state-level trends, the metros with the largest increases in home prices relative to income are concentrated in Western states. Northeastern metropolitan areas are notably absent from the list, indicating that incomes have better kept pace with home prices in those locations. Astonishingly, home prices have outpaced income in nearly 90 percent of U.S. metropolitan areas with at least 100,000 residents.
Here is a summary of the data for the New York-Newark-Jersey City, NY-NJ-PA metro area:
*5-year percentage change in home prices: 19.6%
*5-year percentage change in wages: 11.9%
*Median home price (2019): $483,120
*Median annual wage (2019): $48,840
For reference, here are the statistics for the entire United States:
*5-year percentage change in home prices: 30.7%
*5-year percentage change in wages: 12.0%
*Median home price (2019): $242,058
*Median annual wage (2019): $39,810
For more information, a detailed methodology, and complete results, you can find the original report on Construction Coverage’s website: https://constructioncoverage.com/research/cities-where-housing-costs-have-risen-fastest-relative-to-income


Leave a Comment