

Manhattan’s residential co-op and condominium market ended last year on a more stable note than it did in 2016 despite some signs of trouble, according to Corcoran’s fourth quarter 2017 report.
“Three of the past four quarters registered level or annual increases in closed sales,” said the study. The fourth quarter was essentially unchanged over the same quarter the previous year.
According to Corcoran’s report, the median price for Manhattan condo resales decreased 5 percent over fourth quarter 2016, but strangely the median price per square foot remained unchanged at $1,463 year-over-year. This discrepancy is attributed to “the fall in market share of closings above $1 million.” That fall resulted from the decline in closed sales at new developments, “a decrease that was less a reflection of demand and more about the timing of current building cycle and completions,” said the report.
The median price for Manhattan co-op resales showed similar results during fourth quarter 2017. A positive change of 4 percent over fourth quarter 2016 was indicated, but there was a drop in average price for co-op resales from $815,000 to $785,000, representing a 4 percent decline from third quarter 2017 to fourth quarter 2017, for reasons similar as explained above for condominium sales. In this case, however, the declining market share was in closed sales of units under $1 million. Median price per square foot rose 2 percent year-over-year, reflecting that change.
Perhaps the most significant changes in the market are in inventory and months-of-supply. Market wide, the overall number of units available increased by 9 percent since fourth quarter 2016, jumping more steeply from the third to fourth quarters in 2017. “This represented the highest fourth quarter total since 2011,” said Corcoran. “This inventory increase was fueled by increases in new development inventory at recently launched developments Downtown.”
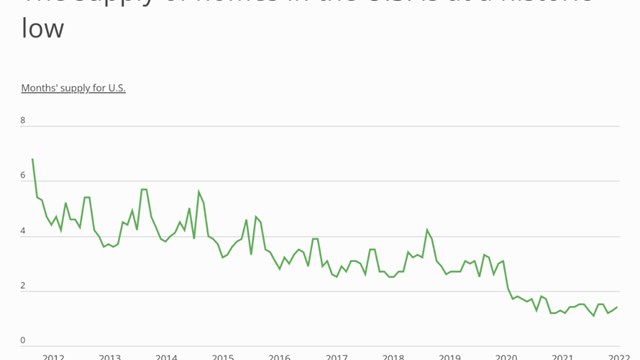
Months-of-supply, which is the measure of how many months it would take for the current supply of units on the market to sell, is considered a good indicator of whether a market is favoring buyers or sellers. Increases in this measurement clearly indicate a trend toward a buyer’s market. That observation can be skewed though, by sudden or steady increases in inventory, such as those observed above. Overall in the Manhattan market, this measure increased 15 percent during this most recent quarter over fourth quarter 2016.
“The market currently favors buyers,” says Bo Poulsen, an agent with brokerage firm Halstead. “I expect 2018 to remain unchanged or perhaps move a bit in the sellers’ direction.”
Overall, closed sales remained virtually unchanged over fourth quarter 2016, though they declined 15 percent over third quarter 2016, a possible “canary in the mine shaft” for 2018. This decline may be related to uncertainty over the new tax bill passed by Congress and signed into law before Christmas. The law severely restricts the deductibility of state and local real estate and income taxes from federal tax calculations going forward. That provision is seen by many as a possible “dampener” on prices in tax heavy states and cities, such as New York.
“The new tax law applies strongly to the New York City market,” says Simon Seaton, an agent also with Halstead, “ and will play a larger role in buyer decisions. Its ultimate affect still remains to be seen.”
From a neighborhood perspective, comparisons are all over the board. Upper Manhattan had the largest decrease in sales and the highest increase in average price per square foot differentially. The Financial District had the largest increase in average price per square foot overall, but the West Side had the highest increase in median price per square foot. The East Side showed the greatest gain in both closed sales and current inventory.
In general, the luxury market showed a significant drop in median price, down 13 percent over 2016. “There are multiple contributing factors to the recent decreases in the luxury threshold and falling prices,” the report states. “Chiefly, the majority of already-signed contracts at large prime developments like 432 Park and The Greenwich Land have already closed, and less expensive closings at developments like One West End and 252 East 57th have taken their place.”
As far as the future of the residential market goes based on last year’s activity, Seaton says, “2017 was an overall steady year with a positive trend for 2018.”
Coming up next week: a look at the Brooklyn residential market.
AJ Sidransky is a staff writer for The Cooperator and a published novelist.


Leave a Comment