

Unlike the residential markets in Manhattan and Brooklyn, co-op and condo sales in Queens have shown some resilience in 2018 -- but signs of trouble may be beginning to materialize.
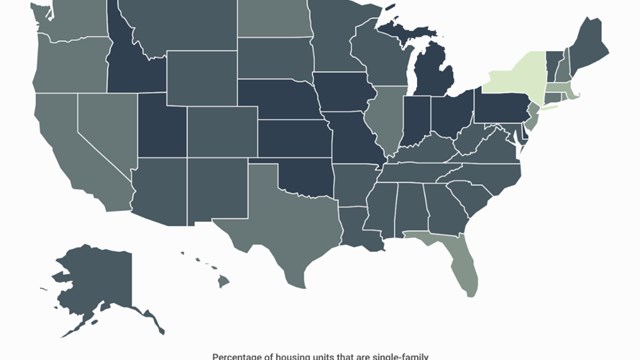
According to Douglas Elliman’s recent fourth quarter report on Queens sales for 2018, “Average price rose 2.1 percent from the prior year, setting a new record for the seventh consecutive quarter.” It should be noted though that with many of its neighborhoods dominated by single-family homes, that statistic includes private dwellings. Median prices for co-ops though, rose 9.1 percent over the same period, showing strength in the co-op market.
The Co-op Market
In the co-op segment of the market, both average sales price and median sales price set new records. Average sales price rose 5 percent, and median sales price rose 9.1 percent. The average sales price for a co-op rose to $300,000 for the first time. Fourth quarter 2018 was the sixth consecutive quarter demonstrating a new record. Interestingly, “Price trends continued to flirt with records even as sales slowed and inventory increased,” says Jonathan Miller, the report’s author and president of Miller Samuel Real Estate, an appraisal and consulting firm based in New York City.
The Condo Market
Conversely, the condo market has showed marked signs of weakness. “Median sales price for condos declined 11 percent year over year to $605,000,” said the report. “Some of this drop may be attributed to a reduction in the average size of newly developed condos. Average unit square footage declined by 12.7 percent.” Smaller units with smaller unit prices—though not necessarily lower prices per square-foot -- may have affected the average results. This change may herald any number of future possibilities, ranging from a market drop in prices to a change in buyer preferences for unit size and type.
Number of Units Sold
Though positive pricing statistics rose, sales were down overall in both the co-op and condo markets. The number of sales in the condo market dropped by 26.6 percent year-over-year, and the number of sales in the co-op market dropped 2.2 percent. It should be noted though that the fourth quarter of 2018 saw a decline in co-op sales of 6.3 percent, which might foreshadow further problems going forward into 2019.
Days on market, which represents the number of days between the date of the last list price change and the contract date, fell to 78 days--a drop of 25.7 percent from the prior year. Listing discount (the percentage difference between list price at time of sale and the sales price)eased to 4.7 percent from 1.5 percent the prior year. Months to sell also slowed, rising from 3.4 months to 4.8 months. All these indicators depict a slowing of the overall market, despite the increases in average and median prices.
Market Segments
The number of sales declined in the south, west, and northeast sectors and the Rockaways, but rose in central Queens--which includes the communities of Forest Hills, Bellerose, Floral Park, Kew Gardens and Rego Park -- among the most accessible and desirable Queens neighborhoods. Price trend indicators declined in all sectors except the Central sector as well, speaking to both the strength of the Central sector neighborhoods and the slippage occurring elsewhere in the borough as the market consolidates.
“2018 was a reset period for Queens,” says Miller, as it was for other parts of New York, “not unlike what we’re seeing in other boroughs.” Many factors are affecting the market both locally and nationally, including consumer anxiety, fluctuating interest rates, changes to the tax law, and local issues. “The expectation,” reflects Miller, “is that 2019 is looking like more of the same.”
AJ Sidransky is a staff writer at The Cooperator, and a published novelist.


Leave a Comment