
When considering whether to buy or rent a home, the rent-to-price ratio—calculated as median annual rent as a percentage of median home price in a given area—can be a useful metric. In locations with high rent-to-price ratios, it may be better to buy, whereas in those with low rent-to-price ratios it can be more cost effective to rent.
In a new report from investment property website Roofstock looking at rent-to-price ratios in the U.S., researchers ranked metropolitan areas according to each’s rent-to-price ratio and included median monthly rent, home prices, and mortgage payments for each location. The rent-to-price ratio in the NYC metro area is 4.69% - meaning that out of all large U.S. metropolitan areas, NYC has the 11th lowest rent-to-price ratio - and suggesting a more attractive housing environment for renters than home-buyers..
A Question of Value
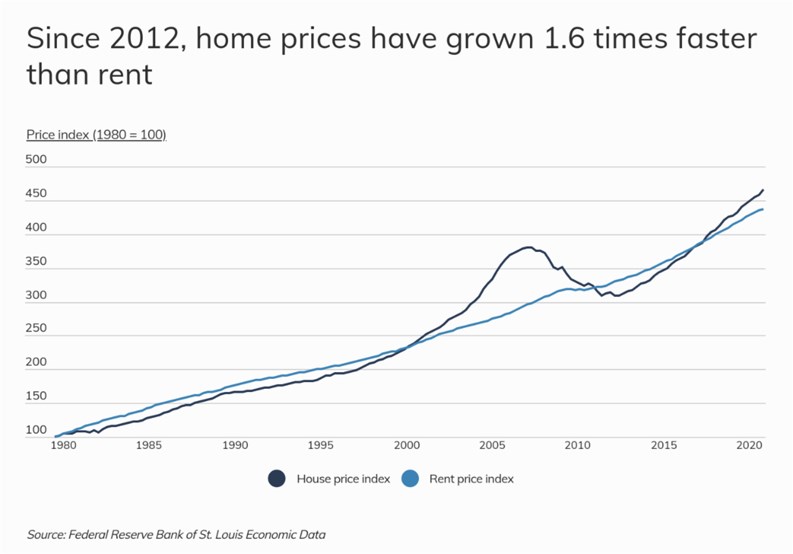
In recent years, home prices have been increasing faster than rents in the U.S., making homeownership less attractive. After dropping significantly during the housing crisis, home prices not only recovered, but rose by nearly 70% from their lowest levels. However, despite rising home values, in some parts of the country renting is still more expensive than owning when comparing monthly rents to monthly mortgage payments.
According to data from the U.S. Census Bureau and the Department of Housing and Urban Development, the median monthly rent in the U.S. is $1,369, while the monthly mortgage payment on a median-price home at current interest rates is less than $900.
Housing and rental prices vary considerably on a geographic basis. When considering whether to buy or rent, the rent-to-price ratio can be a useful metric—calculated as median annual rent as a percentage of median home price in a given area. In locations with high rent-to-price ratios, it can be better to buy; whereas, in those with low rent-to-price ratios, it can be more cost effective to rent.
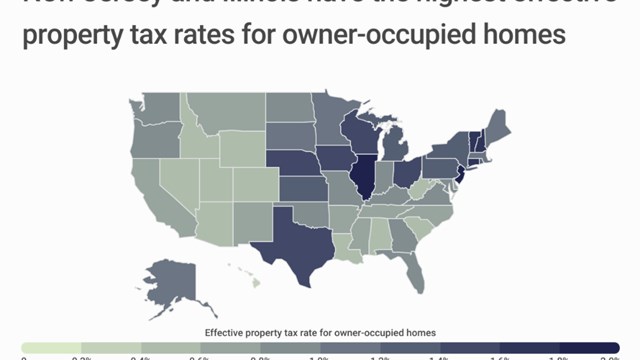
While the overall rent-to-price ratio in the U.S. is 6.26%, these ratios vary considerably across states and metropolitan areas. The West Coast tends to have lower rent-to-price ratios due to sky-high home values and relatively more affordable rents. Rent-to-price ratios are higher in Southern states, which generally have below-average home values. At 9.96%, West Virginia has the highest rent-to-price ratio, meaning it is the most favorable state on average for home buyers and investors looking to acquire rental properties. Median monthly rents in West Virginia are about 2.5-times higher than the mortgage payment on a median-price home. Renters, on the other hand, are better off in Idaho which boasts a rent-to-price ratio of 3.84%.
To find the metros with the highest rent-to-price ratio, researchers at Roofstock analyzed the latest data from the Department of Housing and Urban Development, the U.S. Census Bureau, and Zillow. The researchers ranked metro areas according to the ratio of annual median rent to median home prices. Researchers also calculated the median monthly rent, median home price, and the monthly mortgage payment for a median-price home.
To improve relevance, only metropolitan areas with at least 100,000 people were included in the analysis. Additionally, separate rankings were generated for small (100,000–349,999 residents); midsize (350,000–999,999 residents); and large metros (1,000,000 residents or more).
The analysis found that the rent-to-price ratio in the NYC metro area is 4.69%, suggesting a more attractive housing environment for renters than home-buyers. Out of all large U.S. metropolitan areas, New York City has the 11th lowest rent-to-price ratio. Here is a summary of the data for the New York-Newark-Jersey City, NY-NJ-PA metro area:
Median monthly rent: $1,977
Median home price: $505,569
Monthly mortgage payment for a median-price home: $1,645
For reference, here are the statistics for the entire United States:
Median monthly rent: $1,369
Median home price: $262,604
Monthly mortgage payment for a median-price home: $854
For more information, a detailed methodology, and complete results, you can find the original report here: https://learn.roofstock.com/blog/cities-highest-rent-to-price


Leave a Comment