
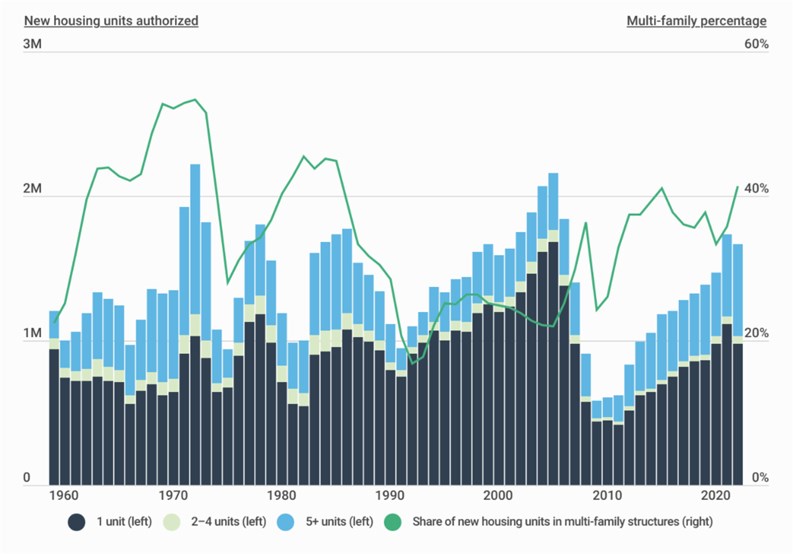
According to a new report on multifamily housing in the United States, 41.4% of new housing units authorized across the country as a whole in 2022 were multifamily, marking the highest level since 1985.
The report, commissioned by construction consulting and risk management firm Construction Coverage, looked at new units authorized by building permits in 2022 as tracked by the U.S. Census Bureau and identified the states and metros building the most multifamily housing.
New York Metro Leads the Pack
The analysis found that 79.3% of the new housing units authorized in the NY metro area were multifamily. In fact, the NY metro is building the largest proportion of multifamily housing out of all large U.S. metropolitan areas.
The original report includes data on more than 350 metros, broken down by size cohort, and all 50 states. Here is a summary of the rest of the data for the New York-Newark-Jersey City, NY-NJ-PA metro:
- Share of new housing units authorized in multi-family structures: 79.3%
- Share of existing housing units in multi-family structures: 57.4%
- Total new housing units authorized in multi-family structures: 46,323
- Total new housing units in structures with 2 units: 1,342
- Total new housing units in structures with 3–4 units: 733
- Total new housing units in structures with 5+ units: 44,248
- Total new single-family units: 12,089
Here are the statistics for the entire United States:
- Share of new housing units authorized in multi-family structures: 41.4%
- Share of existing housing units in multi-family structures: 28.4%
- Total new housing units authorized in multi-family structures: 689,504
- Total new housing units in structures with 2 units: 31,626
- Total new housing units in structures with 3–4 units: 23,205
- Total new housing units in structures with 5+ units: 634,673
- Total new single-family units: 975,584
You can access the entire report here.


Leave a Comment