
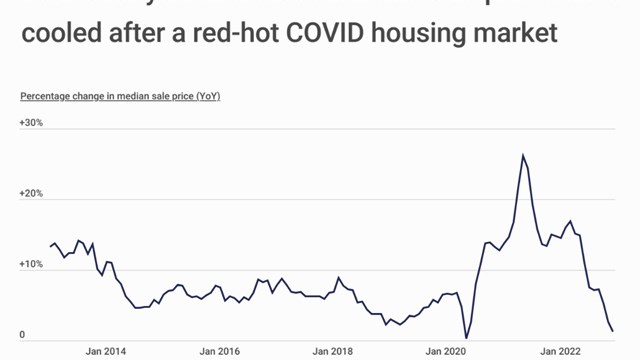
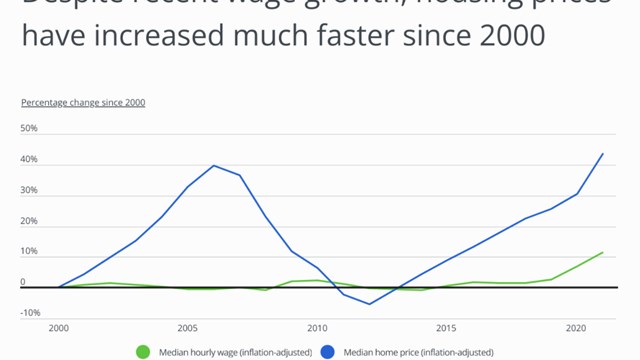
For most households, housing is itself the largest regular expenditure - so the failure of wages to keep up with housing prices can make housing costs even more expensive in real dollars. And since the onset of the pandemic in spring of 2020, housing prices have skyrocketed, with the cost of homes sold in the U.S. increasing by more than 40%.
That said, income growth lagging behind rising housing costs is not a recent development. From 2000 to 2022, the median annual household income in the U.S. increased by 77.6%, from $41,990 to $74,580, while the median home price nearly tripled—a 170% increase—from $123,086 to $332,826. On an inflation-adjusted basis, household incomes increased by just 4.5% since 2000, while home prices increased by 59.1%.This gap between wage growth and home price growth may be most severely felt in areas where home prices are increasing the fastest.
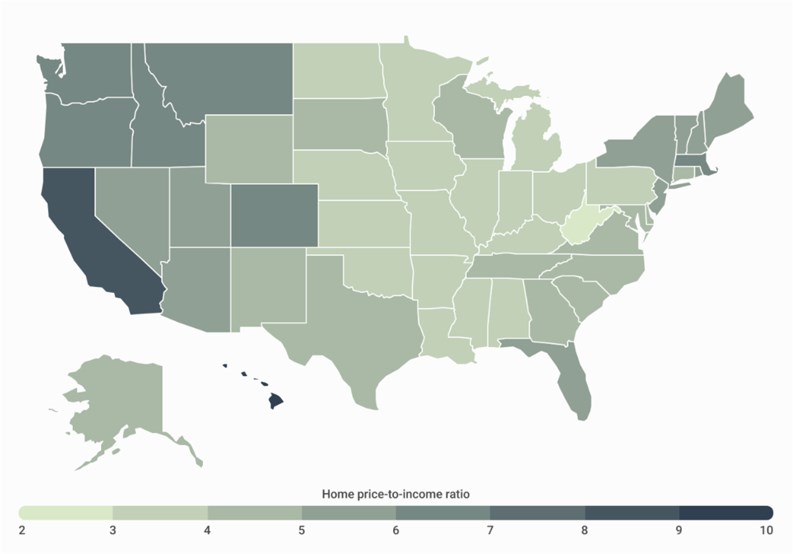
A new report from national construction consulting firm Construction Coverage looked at home price-to-income ratios across the U.S. to get a better sense of this trend. To find the locations with the highest price-to-income ratios, researchers ranked locations by the median home price divided by the median annual household income.
These are the key takeaways from the report for New York, NY:
- The median home price in NYC increased by 5.7% over the past five years, and now sits at $732,594.
- Meanwhile, the median income for NYC households is $74,694—resulting in a home price-to-income ratio of 9.8.
- Among all large U.S. cities, NYC has the 5th highest home price-to-income ratio in the country.
You can read the complete results and methodology of the analysis here, with data on over 380 U.S. cities and all 50 states.

Leave a Comment