Study: Rent is Expensive…But Buying is Worse NYC Homes 46% More Expensive to Buy Than Rent

Study: Rent is Expensive…But Buying is Worse
Graphic courtesy of Construction Coverage

According to a recent study by consulting firm Construction Coverage, the cost of buying a home in the New York City market is nearly half again as expensive as renting one. Then findings confirm a trend that’s been ongoing for a number of years, but which has accelerated as interest rates have climbed to fight inflation. 

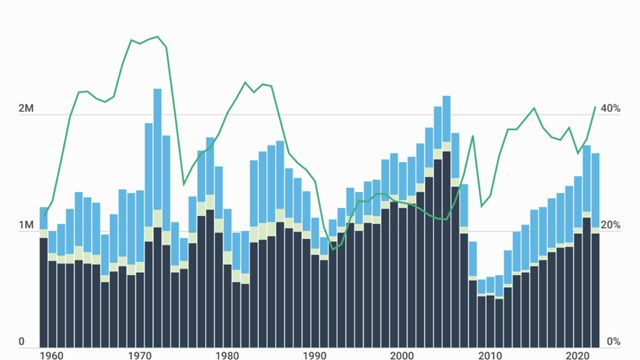
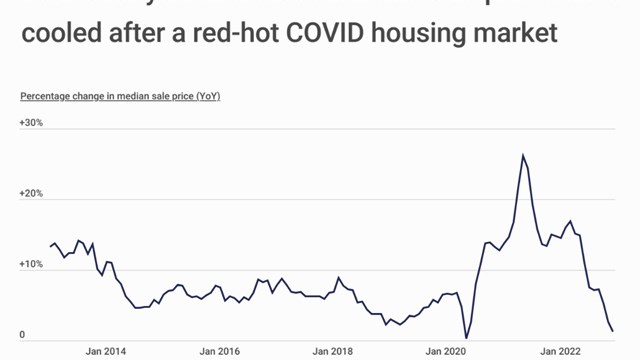
For many years, the typical monthly costs of buying a home—after accounting for sales prices, mortgage rates, and property taxes—were well below the costs of typical rents in the U.S. Even as home prices began to increase amid the competitive market in 2020 and 2021, low interest rates still made buying more affordable.

But beginning in 2022, the combination of high home prices and high interest rates tilted the scales in favor of renting. And as of November 2023, the typical monthly payment for a home in the U.S. was more than 22% higher than the typical monthly rent.

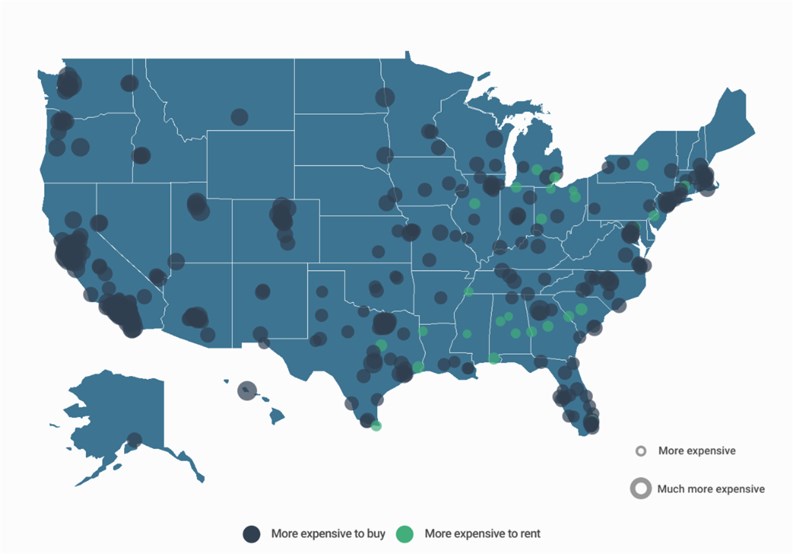
Researchers compared the cost of buying a home with renting one in over 300 U.S. cities and ranked locations accordingly.

These are the key takeaways from the report for New York City:

  • Out of the 338 U.S. cities included in the analysis, only 28 are currently more affordable for buyers than renters

  • New York City isn't one of them: the median monthly mortgage payment is $4,984, while its median monthly rent is $3,424

  • Overall, it costs residents 45.6% more to buy versus rent in New York City, making it much more affordable for renters than homebuyers

  • Click here to read the complete results of the analysis, with data on more thank 300 U.S. cities and nearly 1,000 counties.

    Related Articles

    NY Metro Leads US in Building Most Multifamily Homes

    NY Metro Leads US in Building Most Multifamily Homes

    Multifamily Units Make Up Nearly 80% of New Housing

    flip 2022 to 2023 block with house model. real estate, Home loan, tax, investment, financial, savings and New Year Resolution concepts

    End-of-Year Unit Sales

    Some Advice from the Pros

    Line graph showing decreasing supply of US homes by year from 2012 to 2022

    Study Shows NYC Has Highest Home Inventory in US

    Time on Market Also x3 the National Average

    Arrow showing oscillation, fluctuation or stagnation. Economic crisis, persistence and progress concept. Flat design. EPS 8 vector illustration, no transparency, no gradients

    New York Co-op & Condo Sales in Gridlock - for Now

    High Interest Rates the Main Culprit

    House model, coins, earth globe written with CURB APPEAL.Curb appeal refers to the visual attractiveness of a property, particularly its exterior or front-facing facade, as viewed from the street or sidewalk

    Does Curb Appeal Really Matter?

    Maximizing Aesthetics, Morale, & Value

    Line graph showing home sales prices from 2014 through 2022, illustrating a huge spike in 2020, correlating with the COVID pandemic, with a sharp drop-off in early 2022

    NYC Ranks 4th Lowest on 'Hottest Real Estate Markets of 2022' List

    Residential Market Cooling After Pandemic Spike